Executive Summary
This project analyzes employee data to identify key factors driving turnover and develops a predictive model that can accurately forecast which employees are at risk of leaving the organization.
Key Achievement
Developed a Random Forest classification model that predicts employee turnover with 98.4% precision and 91.5% recall, identifying workload and satisfaction as the primary drivers of retention issues.
Model Precision
Accuracy in predicting turnover
Model Recall
Ability to identify at-risk employees
Key Factors
Primary drivers of turnover
Key Findings
Workload Impact
The analysis revealed a strong correlation between excessive workload and employee turnover:
- 100% of employees with 7 projects left the company
- Nearly 50% of employees with 6 projects departed
- Satisfaction levels drop significantly once employees have more than 6 projects
- Employees working more than 175 monthly hours were classified as “overworked” and showed higher turnover rates
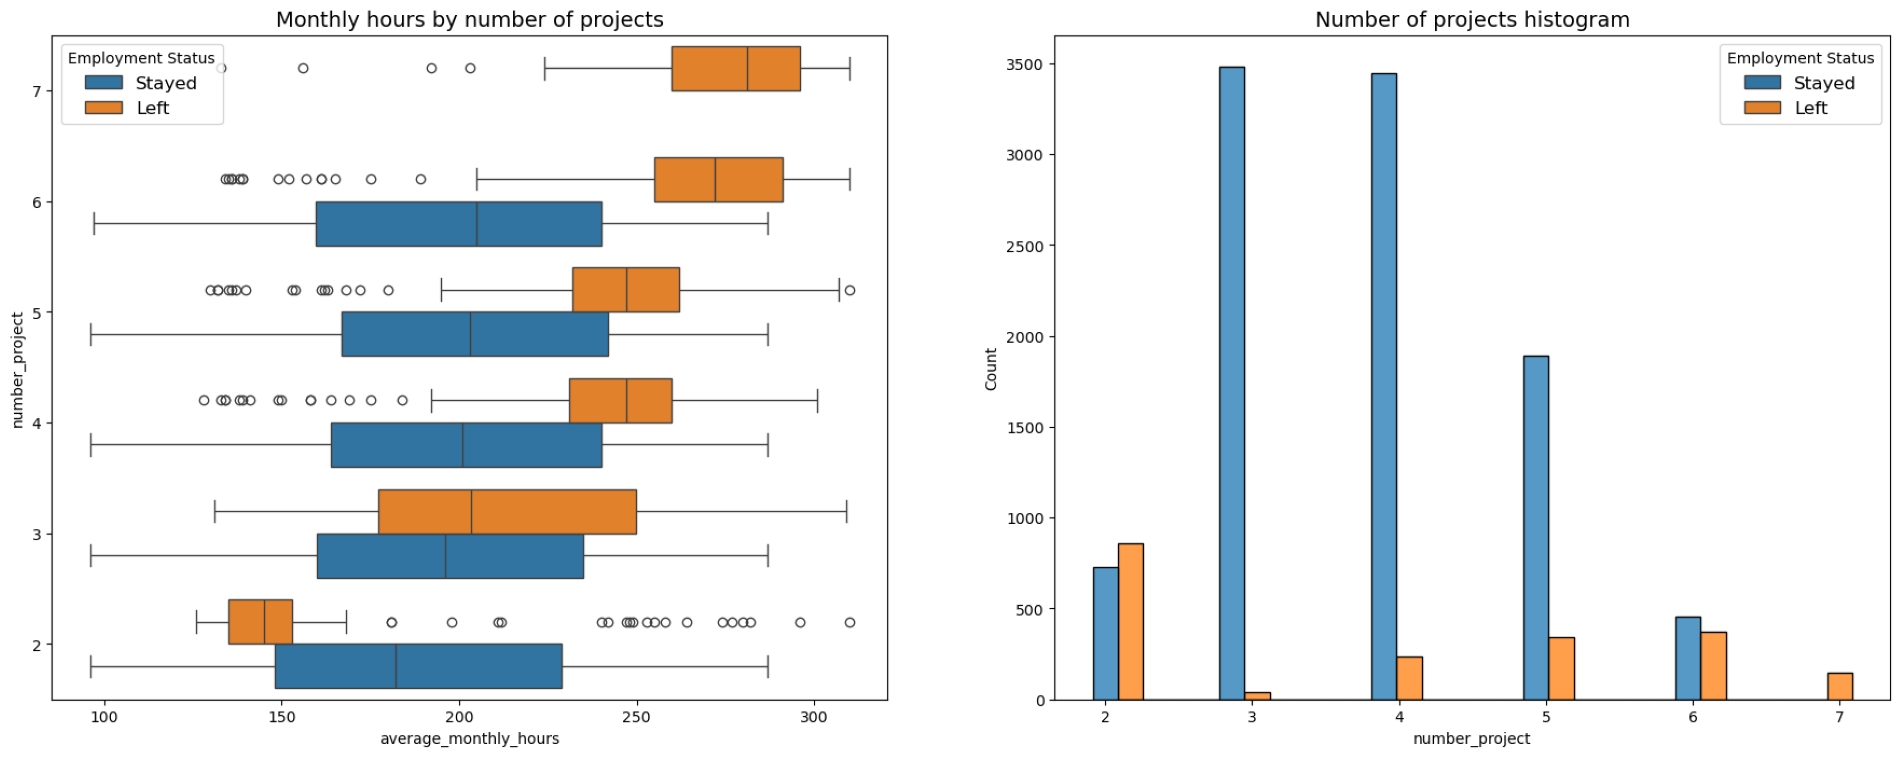
Relationship between number of projects and employee turnover
Tenure and Retention
No employee who had been at the company for more than 6 years left, suggesting longer tenure correlates strongly with higher retention. Focus retention strategies on employees in their first 5 years.
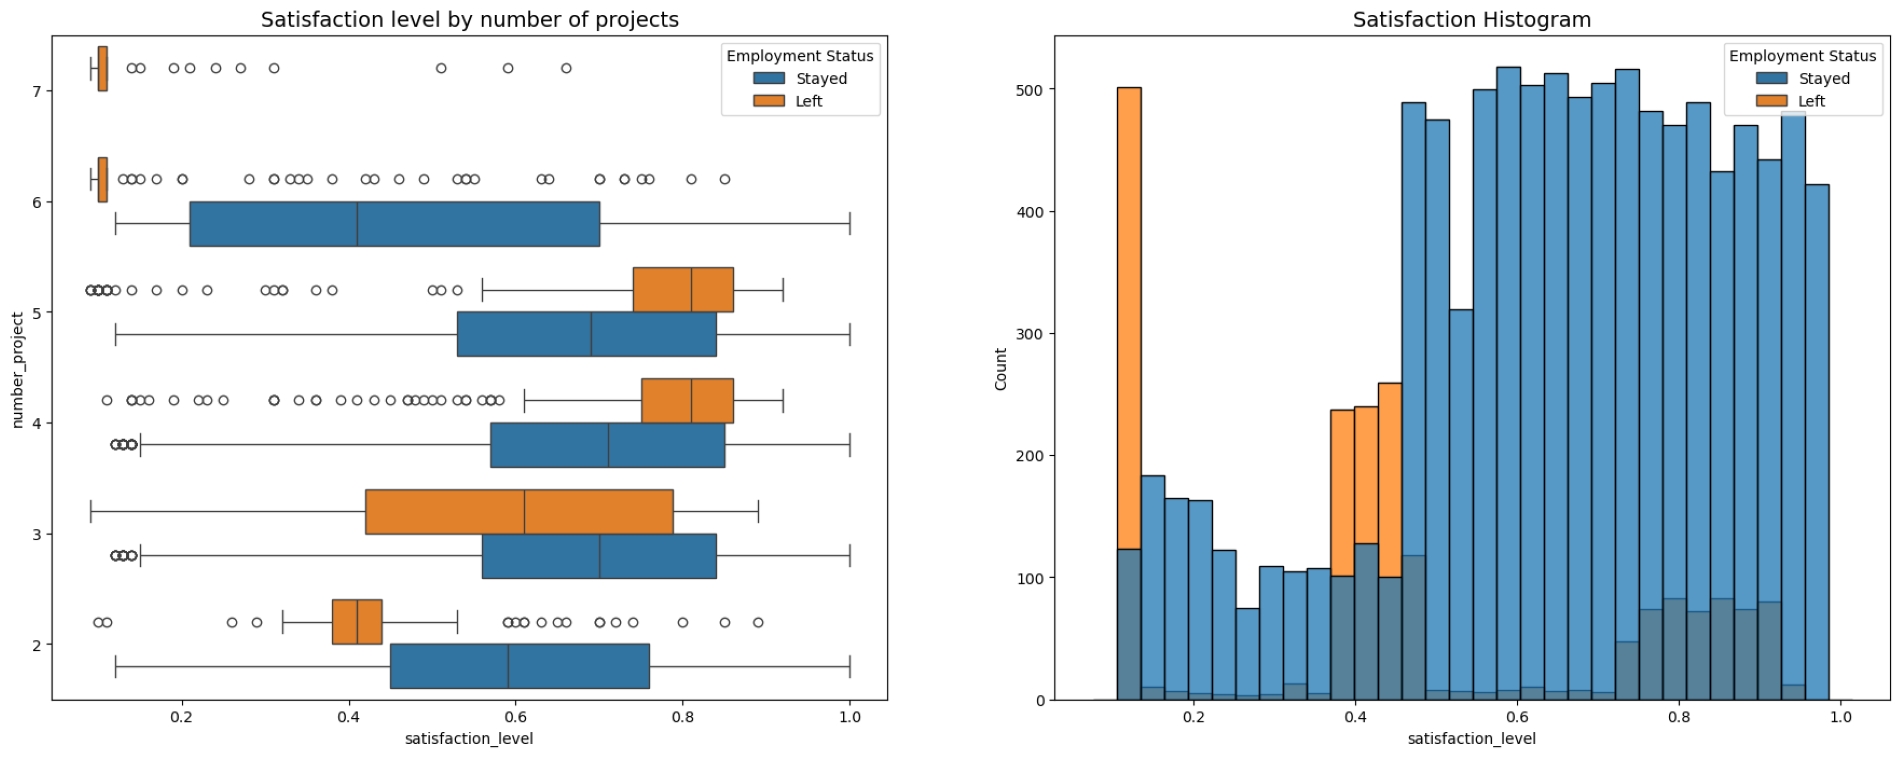
Relationship between working hours, satisfaction, and turnover
Recognition and Workload Balance
Employees who received low evaluation scores despite working fewer hours were at risk of leaving, suggesting recognition/career growth issues. Workload management alone isn’t sufficient—feeling valued matters.
Methodology Overview
This project followed a structured analytical approach to develop a reliable predictive model:
- Data Collection — satisfaction, projects, hours, tenure, turnover status
- Exploratory Analysis — patterns/relationships
- Feature Engineering — e.g., “overworked” flag from monthly hours
- Model Development — Random Forest, Decision Trees, Logistic Regression
- Model Evaluation — precision, recall, F1
- Feature Importance — top predictors of churn
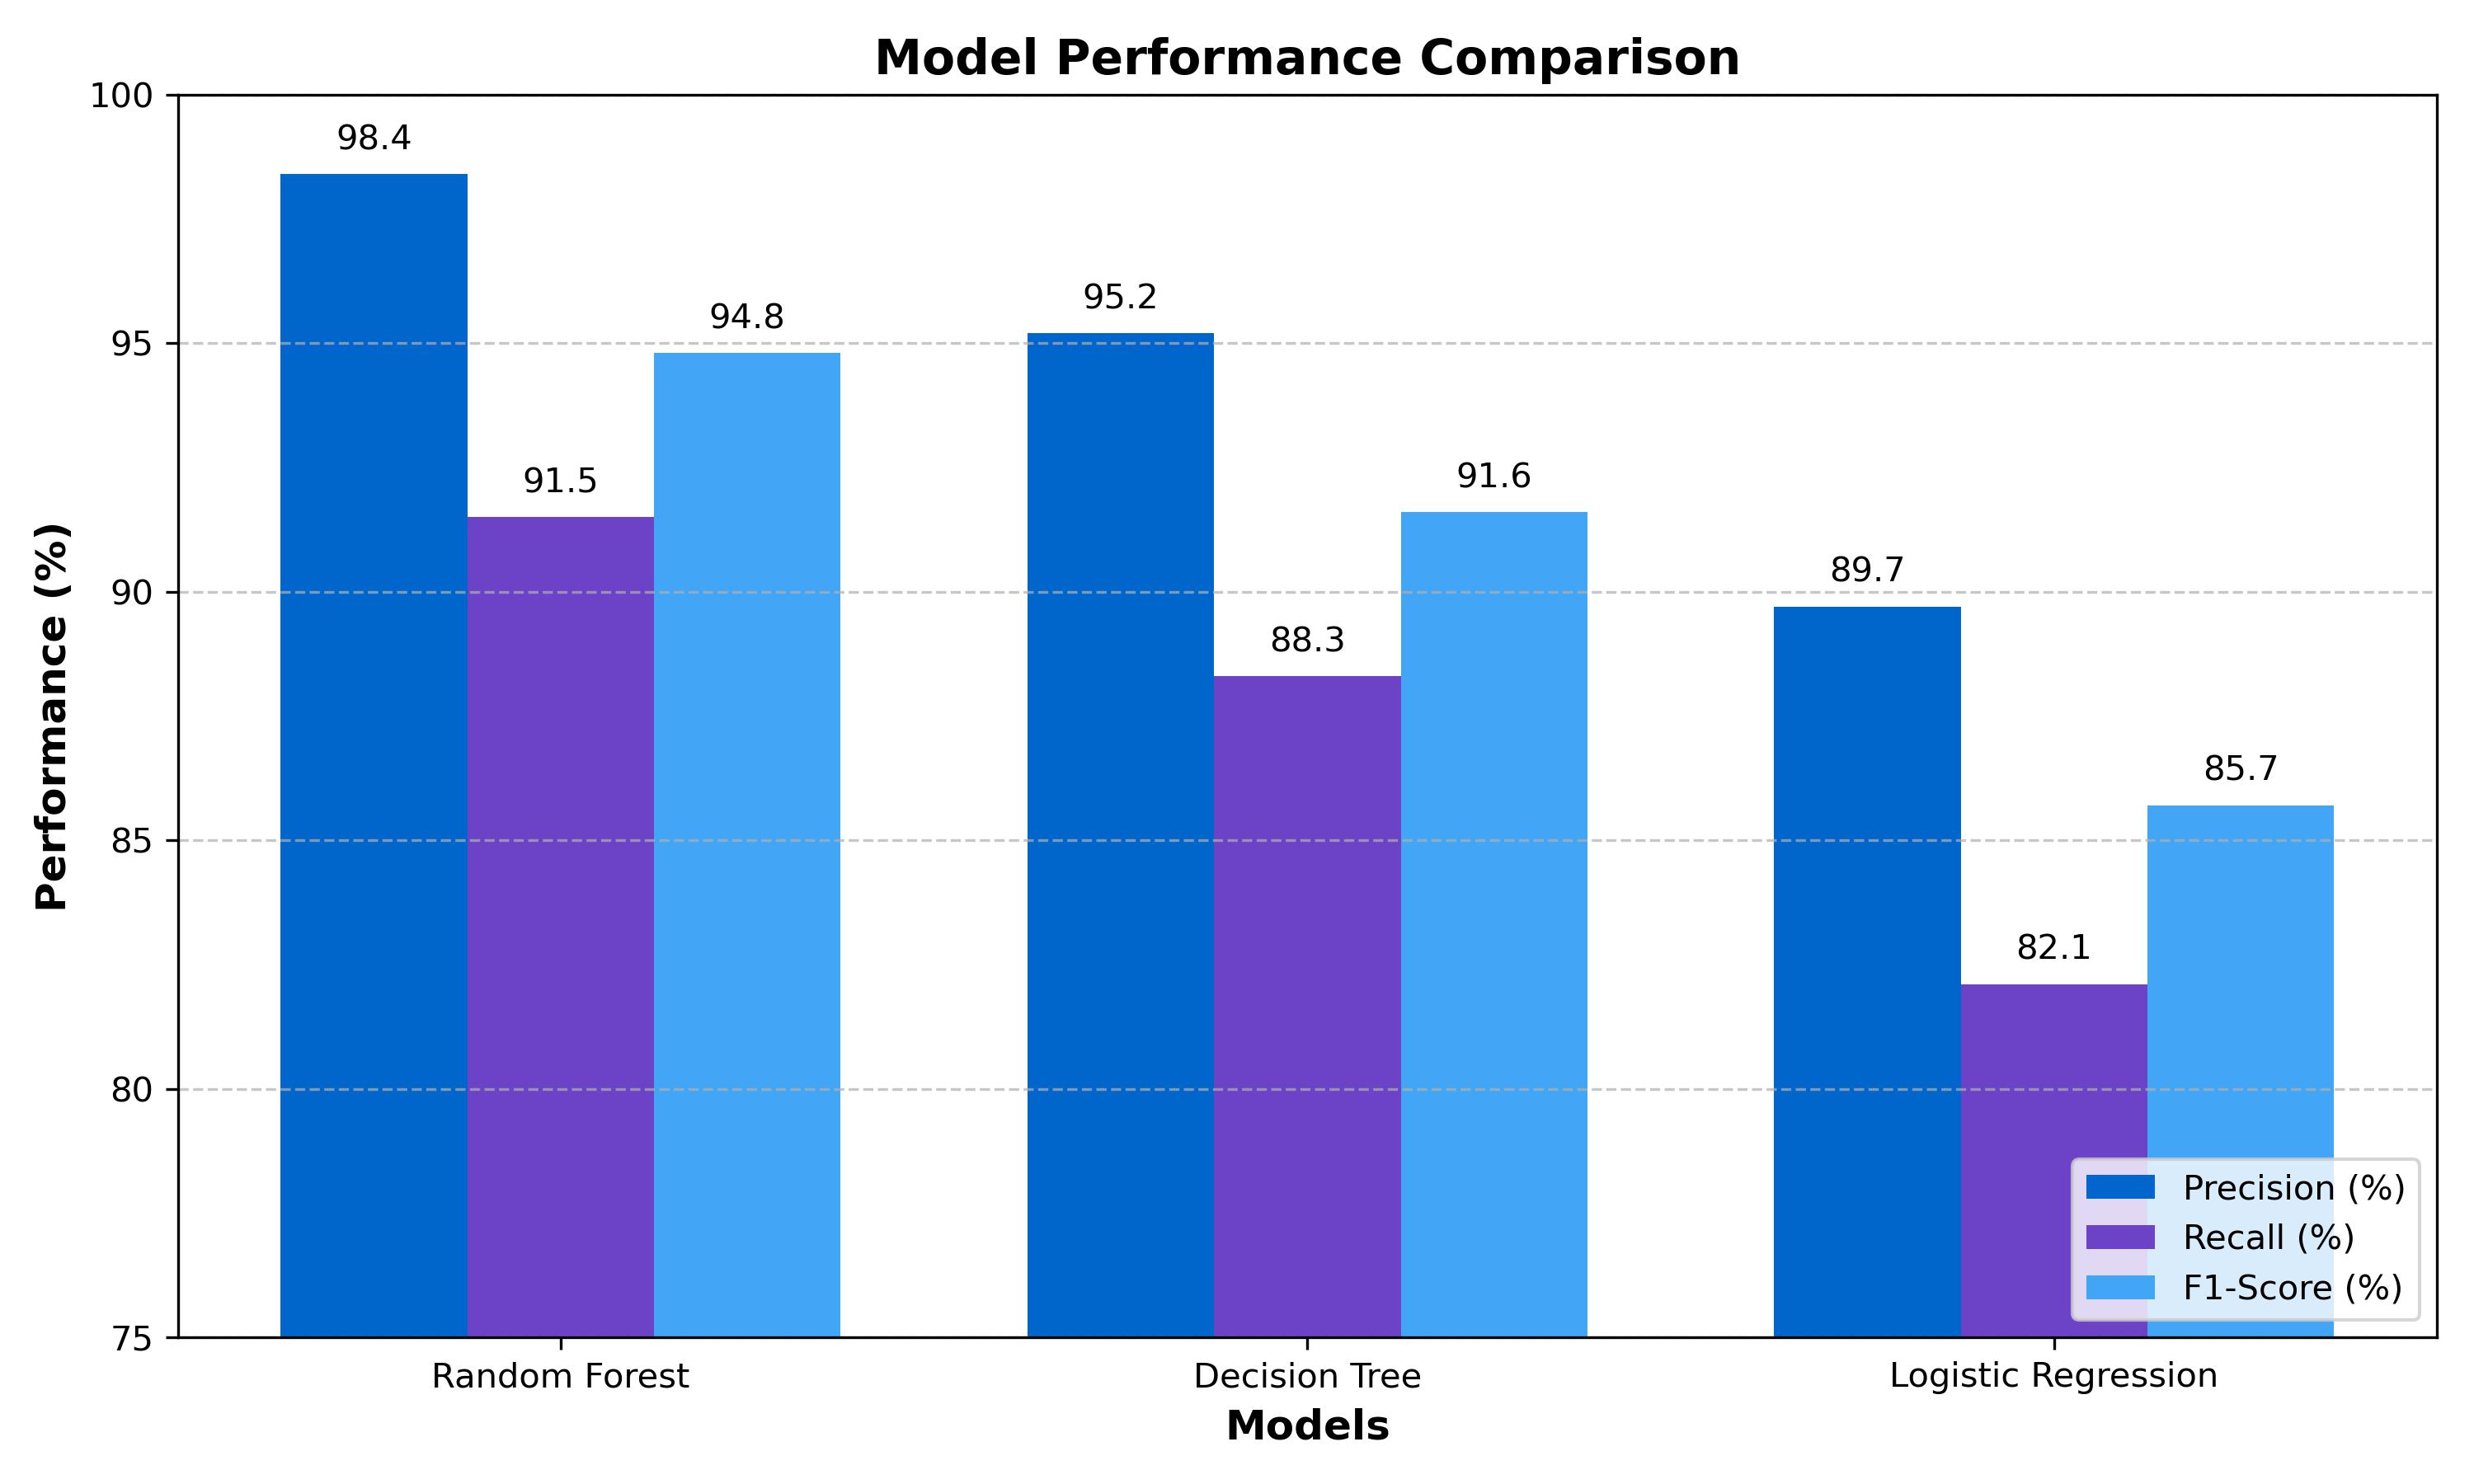
Performance comparison of different classification models
Model Selection Process
- Random Forest — best overall (98.4% precision, 91.5% recall)
- Decision Tree — interpretable; slightly lower precision (95.2%)
- Logistic Regression — simplest; lowest precision (89.7%)
Feature Engineering
- Overworked — >175 hours/month
- Project Load — Low (1–3), Medium (4–5), High (6+)
- Satisfaction Trend — change over time
Feature Importance (Random Forest)
- Number of projects (27.3%)
- Monthly working hours (23.1%)
- Satisfaction level (19.8%)
- Years at company (15.4%)
- Last evaluation score (8.2%)
- Department (3.7%)
- Salary level (2.5%)
Business Applications
This predictive model offers valuable applications for HR and management teams:
Proactive Retention
Identify at-risk employees before they decide to leave for targeted interventions.
Workload Management
Optimize project assignments and hours to prevent burnout and sustain satisfaction.
Strategic Planning
Forecast turnover to plan recruitment needs and maintain operational continuity.
Strategic Insight
Addressing work-life balance and recognition is more effective for retention than focusing solely on compensation.