Executive Summary
This project analyzes 40 years of NBA data (1979–2019) to identify which statistical factors most influence team success and creates a predictive model that can estimate a team's wins based on their performance metrics.
Key Achievement
Developed a linear regression model that accurately predicts NBA team wins based on key performance statistics, with shooting efficiency, offensive rebounds, and turnovers emerging as the most influential factors.
Years of Data
Comprehensive historical analysis
Key Variables
Statistical factors in final model
Focus Period
Post three-point line introduction
Key Findings
Most Influential Factors
The analysis revealed several key statistics that have the strongest impact on an NBA team's win total:
- 2-Point Shooting Percentage — Efficiency in traditional field goals remains crucial
- Offensive Rebounds — Second-chance opportunities significantly impact wins
- Free Throw Percentage — Converting from the line translates directly to wins
- Turnovers — Teams that protect the ball win more games
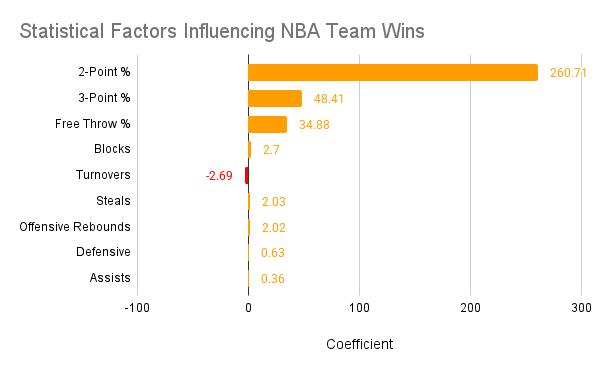
Relative importance of statistical factors in predicting wins
Evolution of the Game
While basketball has evolved, fundamentals like rebounds, steals, and assists have remained relatively stable. Three-point attempts and makes have dramatically increased (especially 2011–2019) while two-point attempts declined.
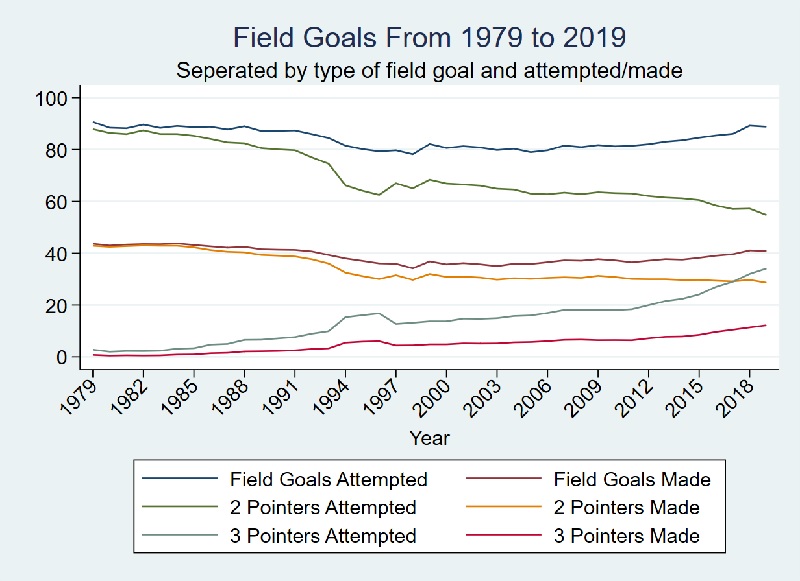
Evolution of three-point shooting in the NBA (1979–2019)
Methodology Overview
This project followed a structured analytical approach to develop a reliable predictive model:
- Data Collection — NBA team statistics from 1979–2019
- Data Preparation — Cleaned and standardized metrics across seasons
- Exploratory Analysis — Identified trends and relationships
- Model Development — Built and refined multiple regressions
- Statistical Testing — Multicollinearity and heteroskedasticity checks
- Model Validation — Residual diagnostics and fit
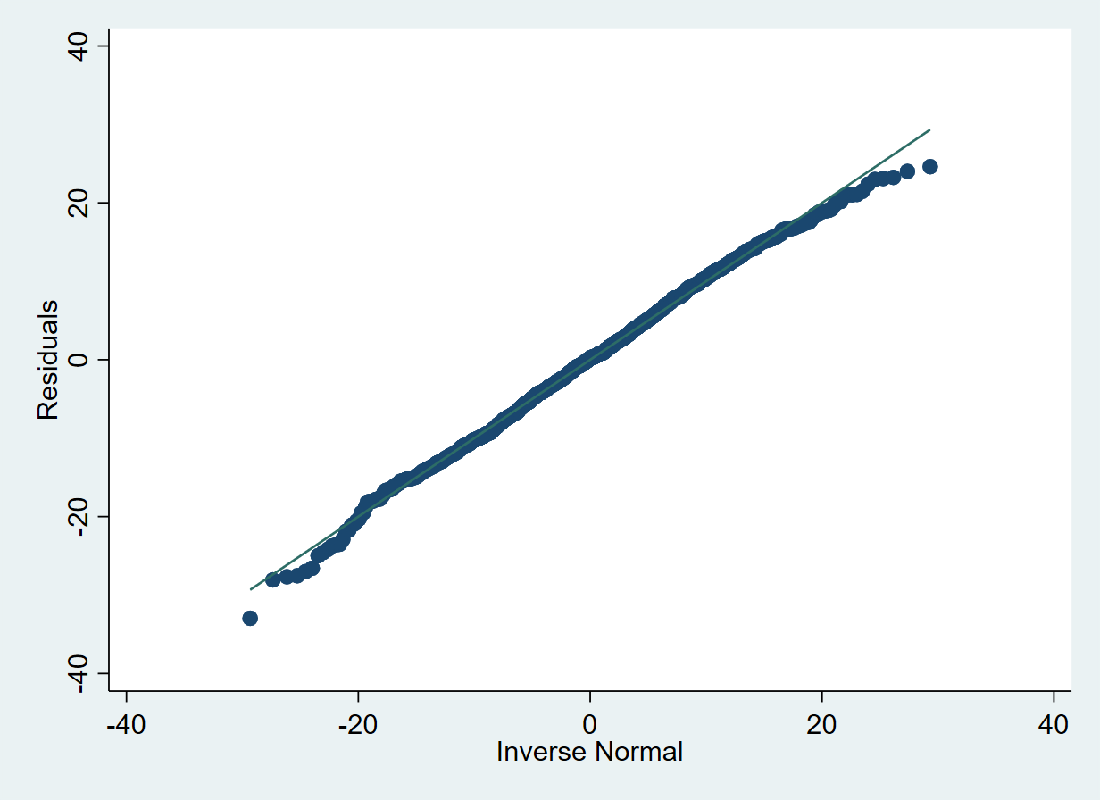
Normal probability plot of residuals indicating model validity
Model Refinement Process
We removed collinear variables (e.g., raw points) and reduced mean VIF to 1.98. The final model passed heteroskedasticity tests (p = 0.5167).
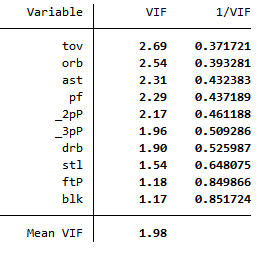
Variance Inflation Factor (VIF) analysis showing low multicollinearity
Final Prediction Equation
ŵ = -169.712 + 260.7082·2P% + 48.4078·3P% + 34.8791·FT% + 2.0234·ORB + 0.6295·DRB + 0.3581·AST + 2.0269·STL + 2.7048·BLK - 2.6861·TOV
Business Applications
Team Management
Evaluate roster changes and prioritize the stats that most move wins.
Sports Betting
Leverage early-season stats to form more accurate performance priors.
Coaching Strategy
Emphasize shooting efficiency, offensive rebounding, and ball security.
Strategic Insight
Prioritize efficiency over volume, hunt second-chance points, and reduce turnovers.
Conclusion & Future Work
The model highlights the statistical levers that most reliably translate to wins, offering a data-driven lens for decisions.
- Add advanced metrics (PER, TS%).
- Team-style specific models.
- Time-series to track importance shifts.
- Player-level integration for roster simulation.